
Texas Triangle: Part 2
The map is a reminder of the counties that comprise the Texas Triangle.

An initial examination of the Texas Triangle includes a correlation between ethnicity and the Biden vote in 2020. Since Biden did poorly among Anglos and less well than Hillary Clinton in 2016 among Hispanics, one might expect those correlations to be modest. Biden and other Democrats have had trouble with support from Anglo voters in Texas for some time, drawing a small percentage of their votes since the realignment of Anglos in the 1990s and 2000s. So the correlation is expected to be negative and fairly strong.
Remember that correlation shows a relationship between variables, and the correlation can be spurious and meaningless. But, ethnicity is a factor in voting behavior as well as partisanship, and thus, it should indicate where Democratic candidates are doing well and where they can improve.
This table shows the data from which the correlations were constructed as well as the Pearson Product Moment correlations of the Biden vote with each ethnicity category:
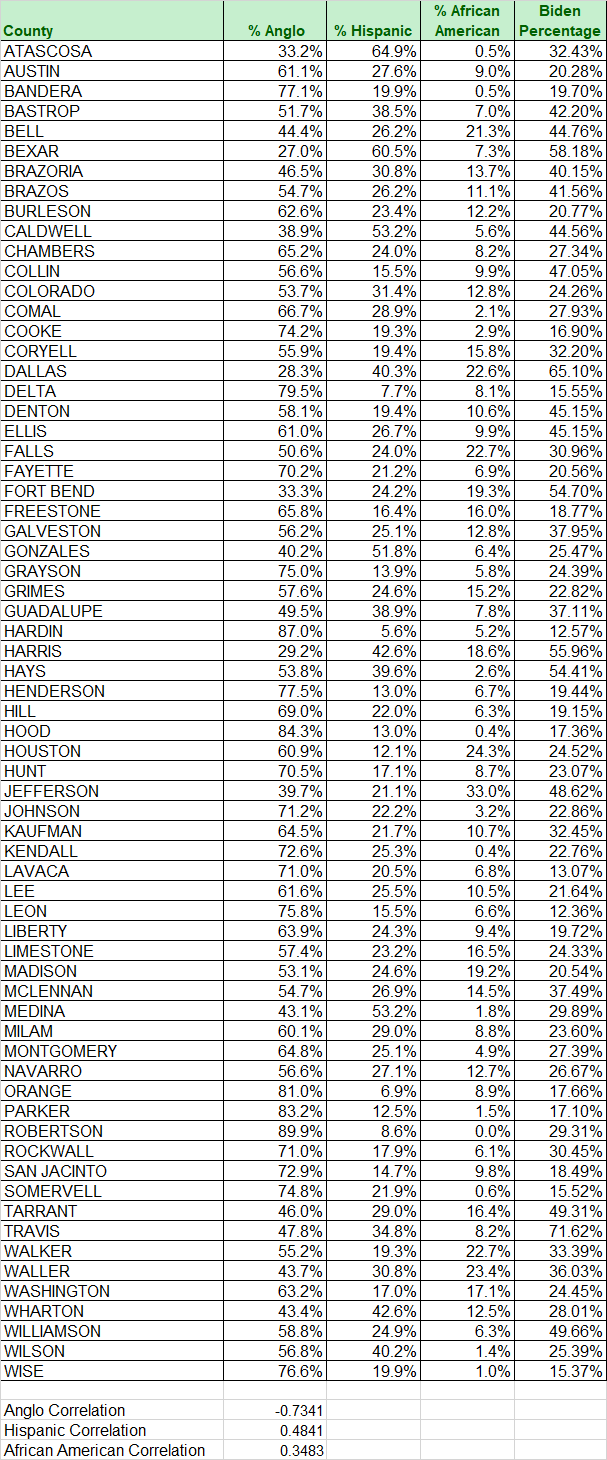
The negative correlation between the Biden percentage of the vote and the Anglo percentage of the population was expected. The correlation is the strongest of the three correlations, indicating that Texas Democratic candidates need to work on their appeal to Anglo Texans. The correlation for Hispanic Texans is stronger than for African American Texans, which I did not anticipate. Traditionally, Democratic candidates receive a greater percentage of support from African Americans than from Hispanics. Democratic candidates need to improve their support from both ethnic groups.
These results suggest where Democratic candidates need to improve their support as well as the counties that offer the most promise in turning Texas "Blue."


Comments
Post a Comment